USGS recently published a map of snow cover index for the coterminous US. They could have just gone with a standard depiction showing a raster coverage with some sort of colour gradient to show low to high. Job done. Except they didn’t.
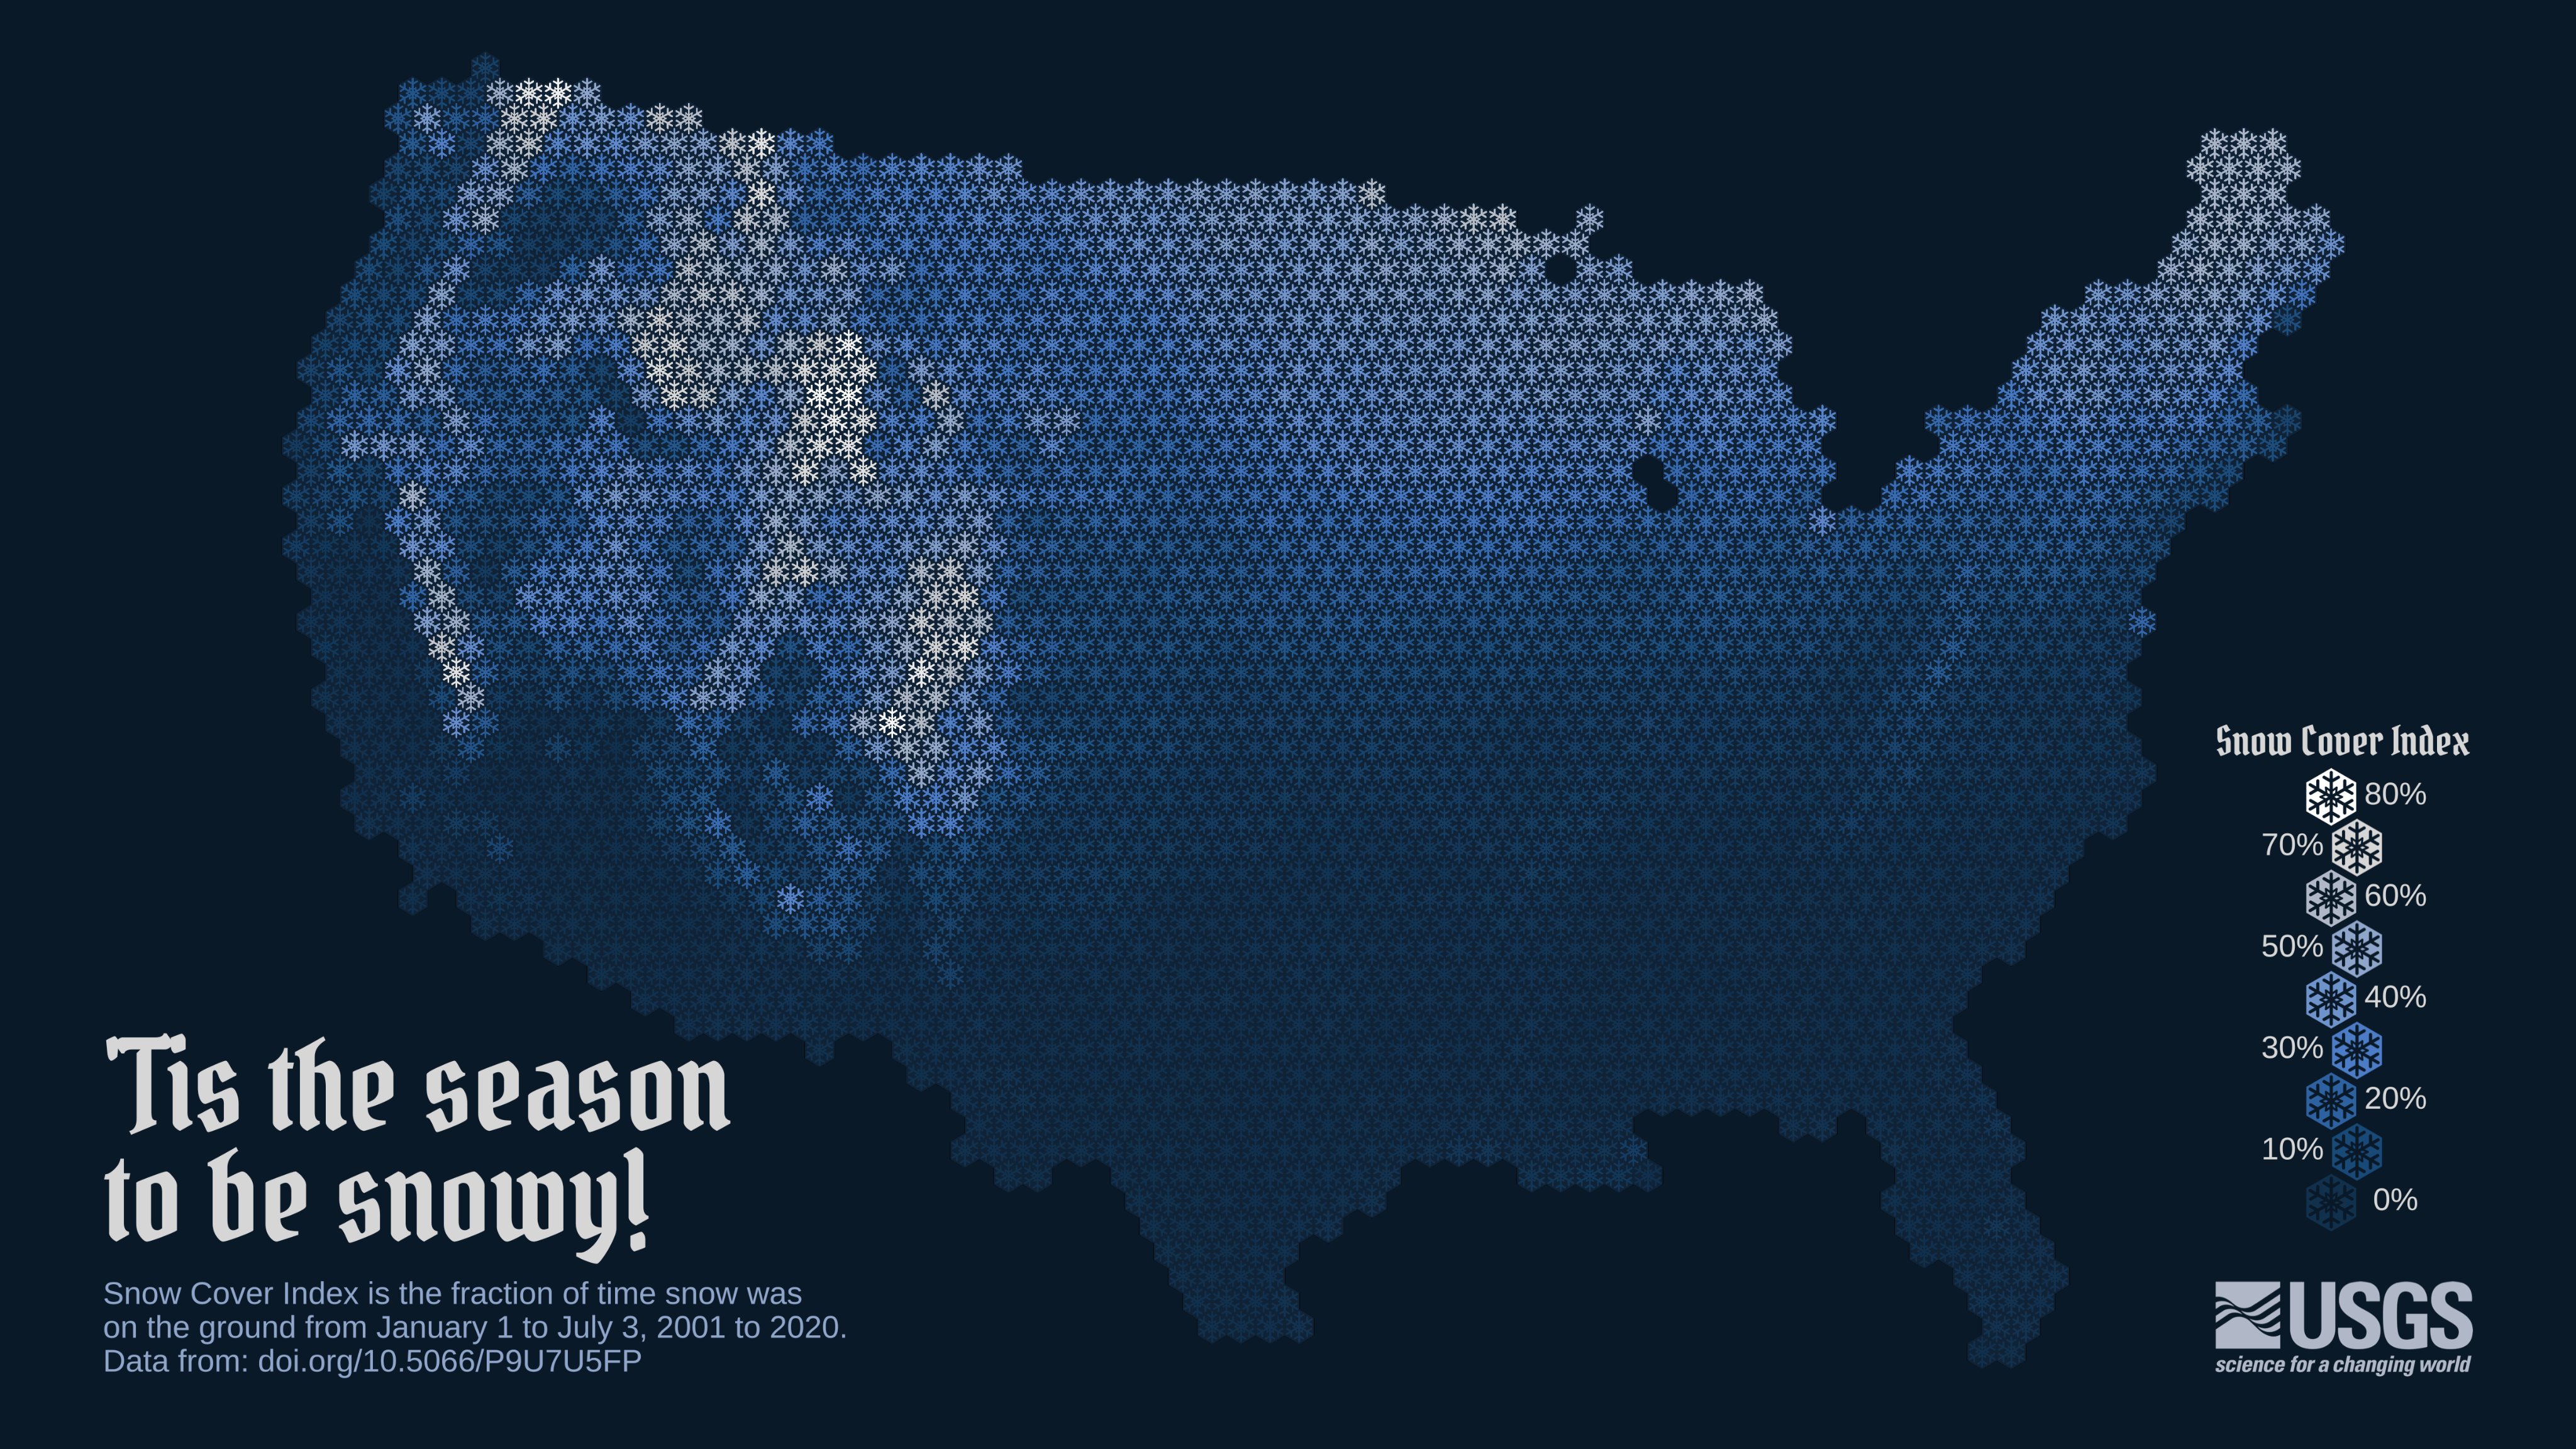
They binned the data into hexagons (the de rigueur choice for binning) and then used a snowflake symbol set within each hexagon, and graded them from near white (most snow cover) to almost the background colour of the map (least snowfall cover. It’s an effective, playful design choice that works.
I also appreciate the choice of Albers for the projection which means the hexagons are, by design, equal area. Far too many hex-binned maps use Web Mercator which simply means the analysis is incorrect as the overlaying hexagons occupy more or less land area depending on their latitude.
I really like this simple but joyous map. And it gave me an idea…stay tuned!